Lesson 2: Where Does our Money Go?
Download Lesson 2, Activity and Handouts
Lesson Overview
In this lesson, students learn how and where the Federal Government spends money. Using the Lesson 2 Activity “To the Penny,” students work in teams to allocate 100 pennies across 14 categories as they think the government allocates money in the Federal Budget. They predict how much of that spending is mandatory vs. discretionary spending and how much of the spending is covered by tax revenue. Along the way, students get to compare their predictions with the actual budget of the Federal Government and discuss ways to deal with the shortfall in tax revenue.
Video Demonstration
Key Terms & Economic Concepts
Choice
- Discretionary Spending
- Entitlement Programs
- Mandatory Spending
- Medicare
- Medicaid
- Opportunity Cost
- Scarcity
- Social Security
Objectives
Students will be able to:
- Explain the difference between mandatory and discretionary spending.
- Identify the largest categories of government spending.
- Describe historical trends in mandatory and discretionary spending as a share of GDP.
- Explain the major factors contributing to modern increases in mandatory spending.
Time Required
1-2 class periods
Materials
- Bags of 100 pennies – 1 bag per 4 students (Alternatives: Use beans or other small manipulatives in place of pennies or copy Handout 2-3 on colored paper and cut to make paper pennies (1 set for each group of 4 students).
- Handout 2-1: 1 copy per 4 students, laminate for reuse
- Handout 2-2: 2 copies per 4 students or copy double-sided and laminate for reuse.
- Highlighters (or expo markers if Handouts 1 & 2 are laminated) – 1 per group of 4 students.
- Optional: 1 copy of Visuals 2-1 & 2-3 for each student
- Optional: 1 copy of Lesson 2 Essential Understandings for each student, if assigned as a student reading
- Virtual Resources: To run this activity virtually, get slides and virtual handouts at www.fte.org
Voluntary National Content Standards in Economics
CONTENT STANDARD 20
Students will understand that federal government budgetary policy and the Federal Reserve System’s monetary policy influence the overall levels of employment, output, and prices.
- Benchmark 4: The federal government’s annual budget is balanced when its revenues from taxes and user fees equal its expenditures. The government runs a budget deficit when its expenditures exceed its revenues. The government runs a surplus when its revenues exceed its expenditures.
- Benchmark 5: When the government runs a budget deficit, it must borrow from individuals, corporations, or financial institutions to finance that deficit.
- Benchmark 6: The national debt is the total amount of money the federal government owes. This is the accumulated net sum of its annual deficits and surpluses. The government pays interest on the money it borrows to finance the national debt.
Activity: To The Penny
NOTE: This lesson uses the 2021 Federal Budget, which was the most recent budget available to the public through the Congressional Budget Office when this lesson was updated in January of 2023. The Federal Government’s fiscal year runs from October – September, meaning the 2021 budget was for the period of October 2020 – September 2021. For the most recent budget data visit https://www.cbo.gov/data/budget-economic-data#2
Lesson 2 Essential Understandings
Government spending falls under two broad categories:
Discretionary Spending – Elected officials have the discretion to change this spending from year to year as part of the annual budget and appropriations process.
Mandatory Spending – Spending is determined by law (prior commitments made by the government) and cannot be changed as part of the annual budget and appropriations process.
Discretionary Spending
Discretionary spending is usually broken into two categories: defense spending and non-defense spending.
- Defense spending is spending on the military and includes things like payroll for military personnel, weapons, and maintenance on equipment. Defense spending is the largest component of discretionary spending, but it has been declining as a share of government spending over the past 50 years. In 1962, defense spending was 50% of the entire federal budget and 70% of discretionary spending. In 2019 it had fallen to 15% of the entire budget and 50% of discretionary spending. Another way to think about the amount of defense spending is as a proportion of GDP. Defense spending has fallen from 9% of GDP to just over 3% of GDP since 1962.
- Non-Defense spending includes things like education, NASA, low-income housing provided by the Department of Housing and Urban Development, etc. Unlike defense spending, non-defense spending has been remarkably constant. It has made up between 15-25% of the total budget and about 4% of GDP since the 1960s.
Figure 1: Defense Spending as a Percentage of GDP
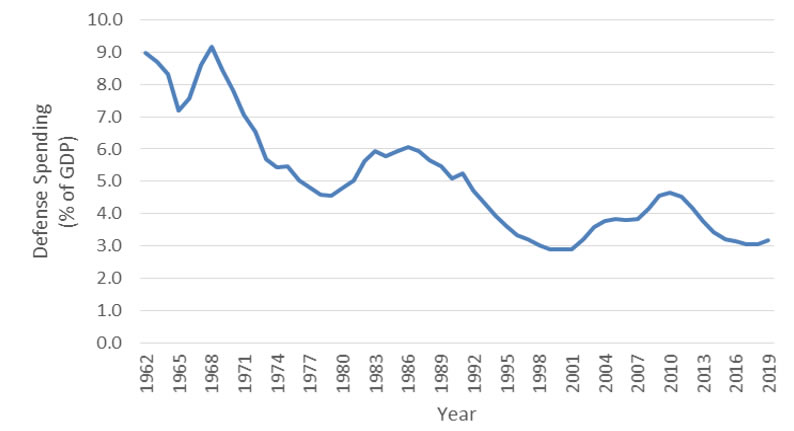
Source: Congressional Budget Office.
Figure 2: Non-Defense Discretionary Spending as a Percentage of GDP
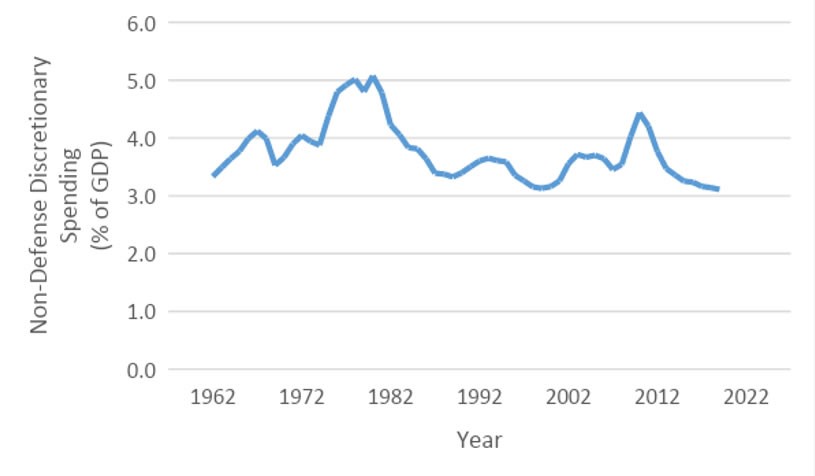
Source: Congressional Budget Office.
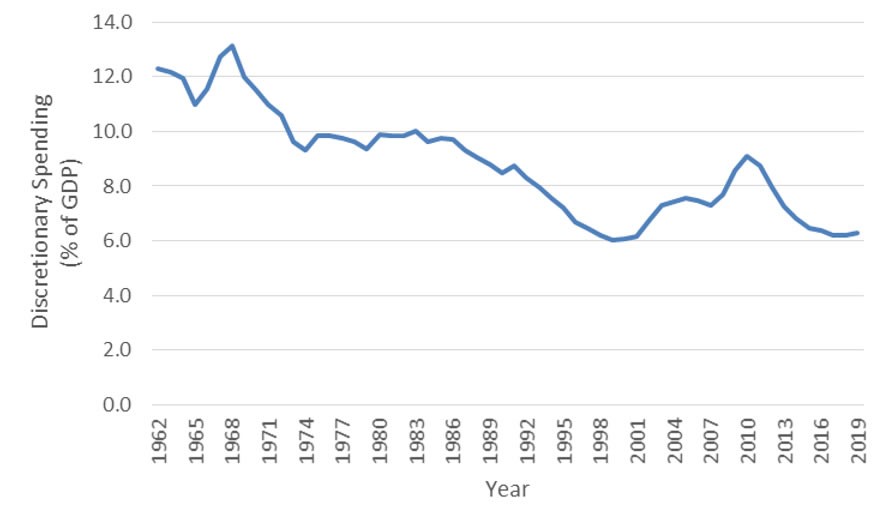
Discretionary Spending has been shrinking as a percentage of government spending and as a percentage of GDP. In 1962 it was two-thirds of all federal spending, and in 2019 it was less than one-third. In that same time, it fell from over 12% of GDP to just over 6%.
Figure 3: The Changing Distribution of Federal Spending
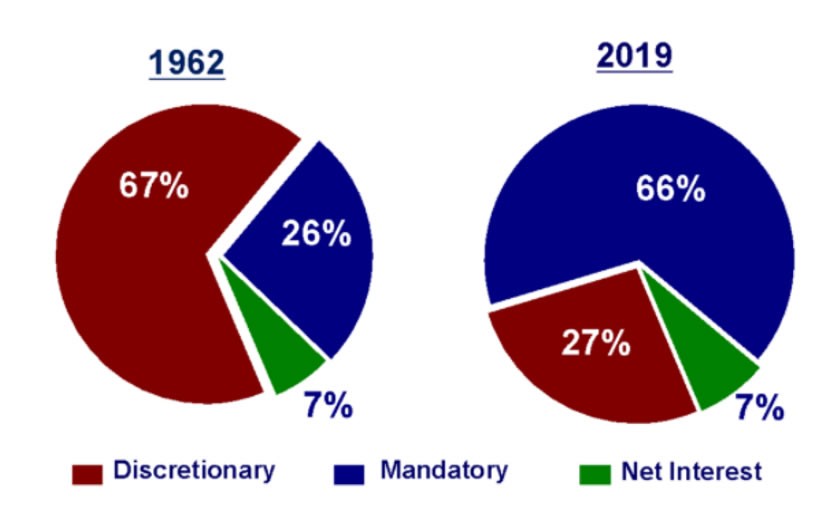
Source: Congressional Budget Office
Figure 4: Discretionary Spending as a Percentage of GDP
Source: Congressional Budget Office.
Mandatory Spending
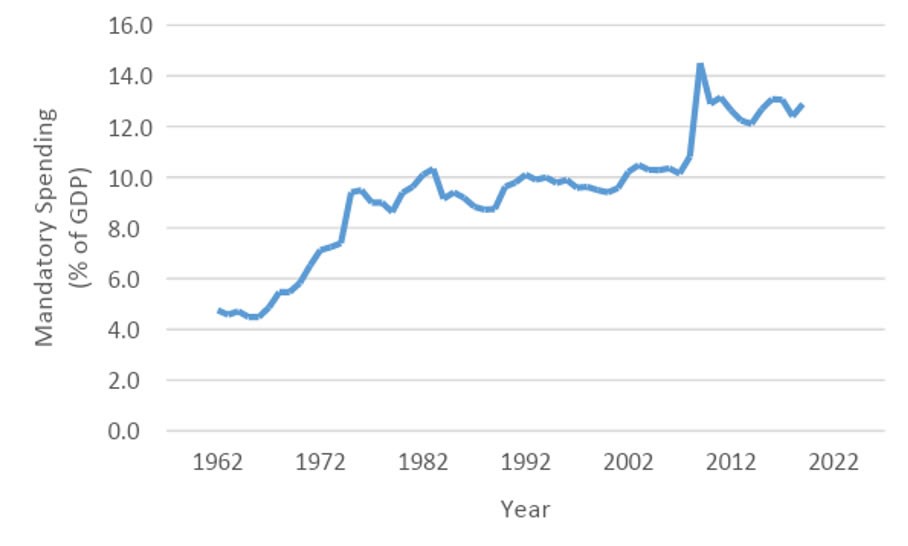
Mandatory spending is spending required by past commitments made by the government. Most mandatory spending is on programs referred to as entitlement programs because people have paid into the programs with the expectation that they would receive benefits at a later date. Medicare, Social Security, and federal pensions are examples of entitlement programs. Mandatory does not mean unchangeable, but it does mean that change has to come about by changing the laws that dictate the spending.
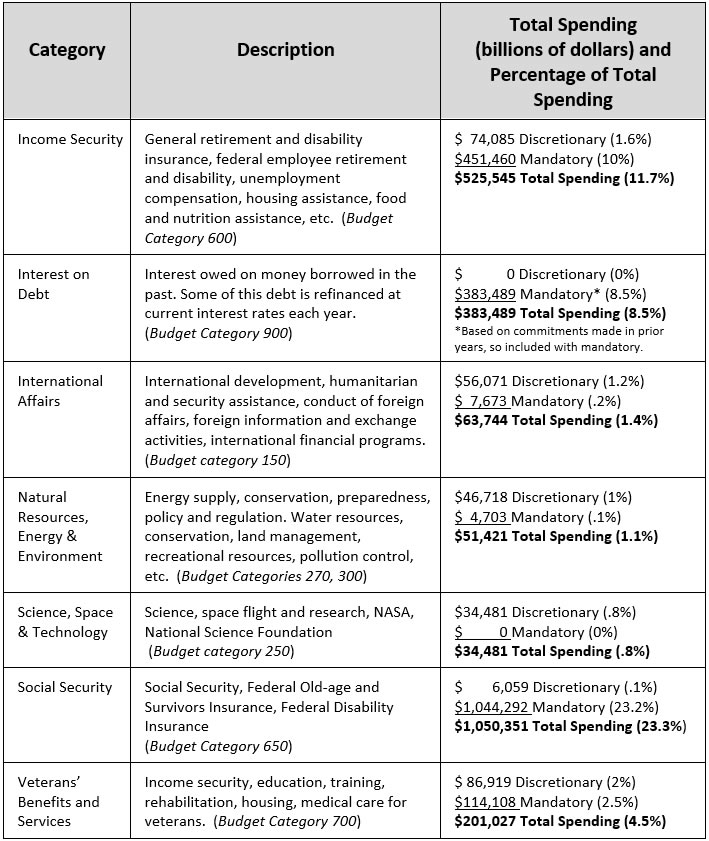
Mandatory spending accounts for two-thirds of the federal budget, and it has increased from 4.8% of GDP in 1962 to 12.9% of GDP in 2019.
Figure 5: Mandatory Spending as a Percentage of GDP
Source: Congressional Budget Office.
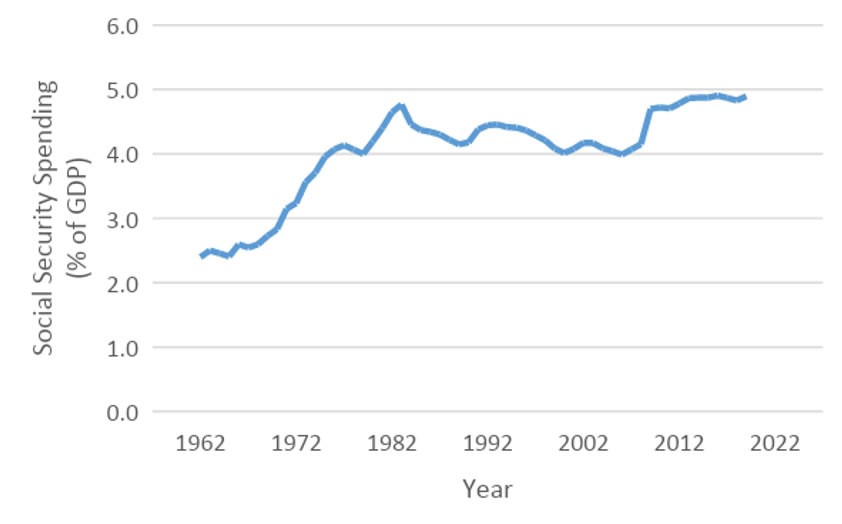
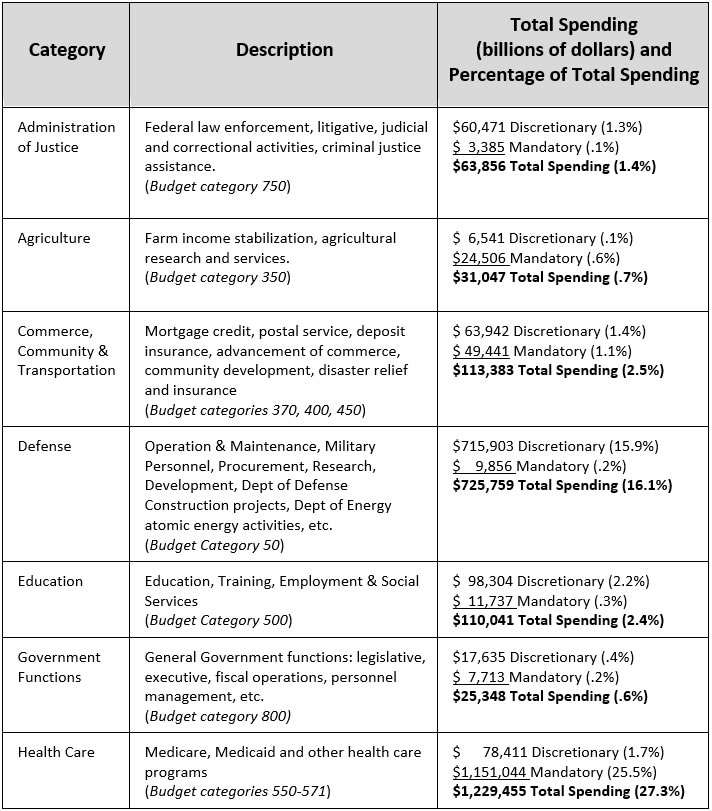
The growth in mandatory spending is driven by the three largest categories of mandatory spending: Social Security (24% of the overall budget), Medicare (14% of the overall budget), and Medicaid (9% of the overall budget).
- Social Security is the Old Age, Survivors And Disability Insurance Program (OASDI), and it is run by the U.S. federal government. It provides retirement benefits, survivor benefits, and disability income. Between 1962 and 2019, Social Security spending grew from 2.4% to 4.9% of GDP (Figure 6). The main contributor to this growth is that there are more retirees now than ever before. People are living longer than they were back in 1962, but the retirement age to claim Social Security has not changed enough to keep pace. Between 1962 and 2019, life expectancy in the United States increased by 7 years. However, the age of retirement for Social Security has only increased from 65 to 67. Therefore, people are living an additional 5 years on Social Security, which has increased the amount of spending on the program. In addition to people living longer, the baby boomers are starting to retire. As this large segment of the population moves into retirement, it will lead to an additional strain on the Social Security system. In 2019, Social Security outlays were $1,038 billion; they are expected to increase to $1,926 billion by 2030. That is the annual rate of increase of almost 6%, which is much faster than the expected growth of GDP over the same period of time (Posmanick and Baier).
Figure 6: Social Security Spending as a Percentage of GDP
Source: Congressional Budget Office.
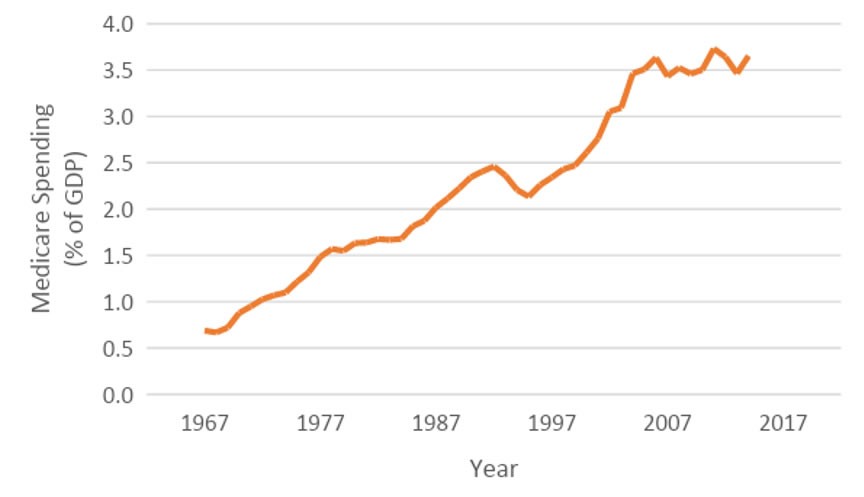
- Medicare is the federal health insurance program for people who are 65 or older and younger people with certain health conditions like ALS, kidney failure, and COVID-19 (US Centers for Medicare & Medicaid Services). Medicare spending did not begin until 1967, but expenditures on Medicare have seen an increase from effectively 0% of GDP in 1962 to 3.7% of GDP in 2019 (Figure 7). Medicare has expanded as rapidly as it has for many of the same reasons that Social Security spending has—namely, the aging of the population. However, Medicare spending has increased faster than Social Security because Medicare spending increases not only with the age of citizens but also with the price of medical services. As medical costs have increased over the last 50 years, so has the percentage of GDP needed to provide Medicare (Posmanick and Baier).
Figure 7: Medicare Spending as a Percentage of GDP
Source: Congressional Budget Office.
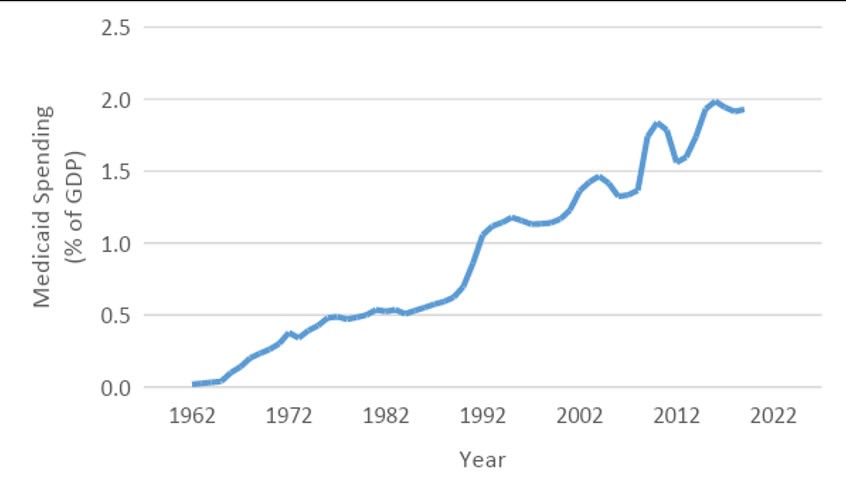
- Medicaid is similar to Medicare, but instead of acting as insurance for older Americans, Medicaid acts as health insurance for poor Americans. Medicaid spending has increased from 0% of GDP in 1962 to 1.9% of GDP in 2019. The increase was particularly pronounced during the early 90s, during the great recession, and with the passage of the Affordable Care Act and subsequent Medicaid expansion in 2010. But unlike the other components of mandatory spending, it is somewhat cyclical. The reason for this is straightforward: when the economy goes into a recession, more people will qualify for and receive payment from Medicaid, and when the economy is expanding, fewer people will be eligible for Medicaid, and more periodic payments are likely to go out.
Figure 8: Medicaid Spending as a Percentage of GDP
Source: Congressional Budget Office.
- Interest Payments on the debt are another type of mandatory spending. They make up 8% of the overall budget. While the interest payments are not determined by legislation, they are payments the government committed to when they borrowed the money. They are payments to bondholders or those who lent the government money by buying bonds. This includes individuals, corporations, state or local governments, the Federal Reserve Banks, foreign governments, and entities outside the U.S. Interest payments as a percentage of GDP have not changed much since 1962, but they have ranged from 1.2% to over 3% (Figure 9). Two things can cause a growth in interest payments: higher interest rates and higher levels of debt. While interest rates have actually been decreasing, the level of federal debt has been increasing, and both of these will influence future interest rates.
Figure 9: Net Interest Expenditures as a Percentage of GDP
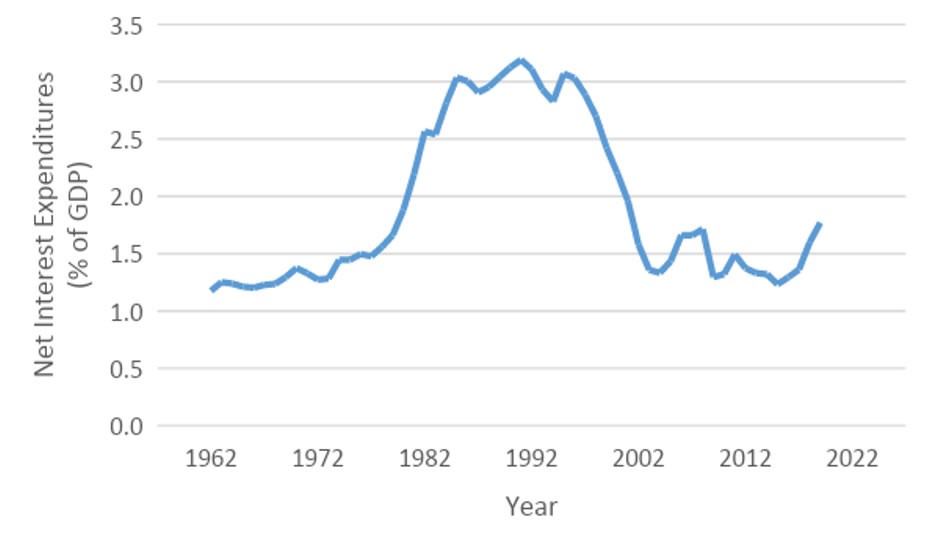
Source: Congressional Budget Office.
- Other mandatory spending includes pensions for federal employees, veterans’ benefits, and income security, but these categories are relatively small compared to Medicare, Medicaid, and Social Security.…)
Looking forward, the Congressional Budget Office projects that federal spending as a percentage of GDP will continue to grow. Discretionary spending will continue to decline as a percentage of GDP, and mandatory spending will continue to rise.
Figure 10: Projected Federal Spending as a Percentage of GDP
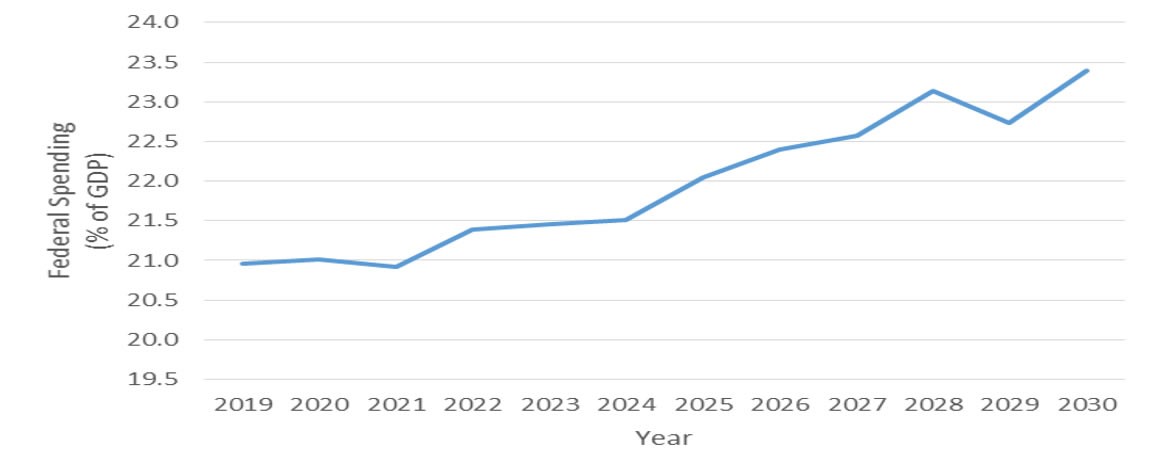
Source: Congressional Budget Office.
Figure 11: Projected Mandatory Spending as a Percentage of GDP
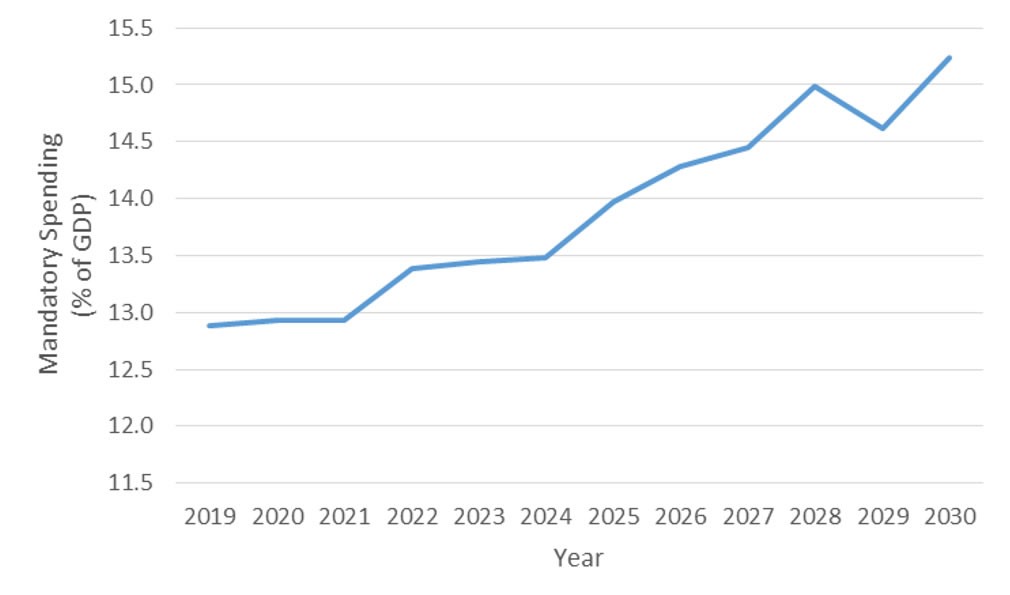
Source: Congressional Budget Office.
Figure 12: Projected Discretionary Spending as a Percentage of GDP
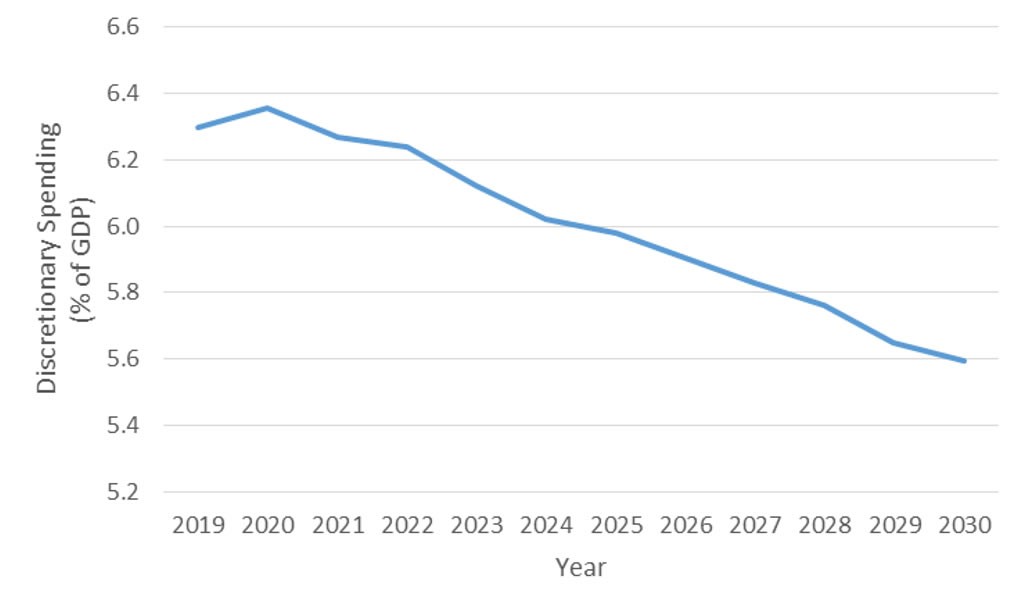
Source: Congressional Budget Office.
Sources
Capretta, James C. “Fiscal Policy and the Major Entitlements: An Introduction.” Foundation for Teaching Economics, 2020, www.fte.org.
Posmanick, and Scott Baier. “Federal Debts and Deficits: Past, Present and Future.” Foundation for Teaching Economics, 2020, www.fte.org.
US Centers for Medicare & Medicaid Services. “What’s Medicare?” Medicare.Gov, Centers for Medicare & Medicaid Services., https://www.medicare.gov/what-medicare-covers/your-medicare-coverage-choices/whats-medicare. Accessed 20 10 2020.
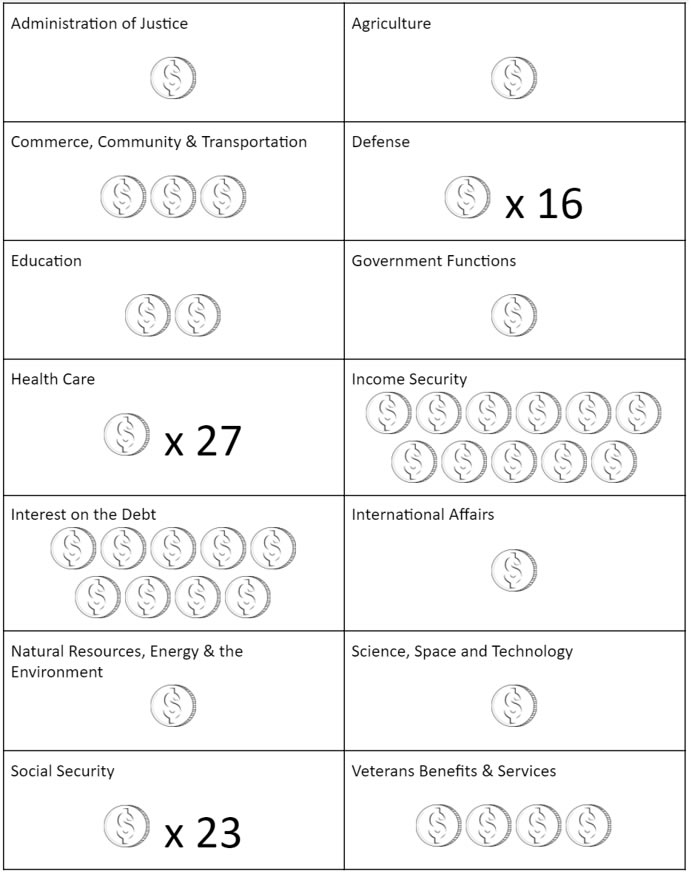
Handout 2-1: Budget Allocation – Prediction
Directions: Arrange 100 pennies in the categories below as you think they are allocated in the Federal Budget. One penny = 1% of federal spending.
Handout 2-2: Mandatory & Discretionary Spending
Handout 2-3: Pennies

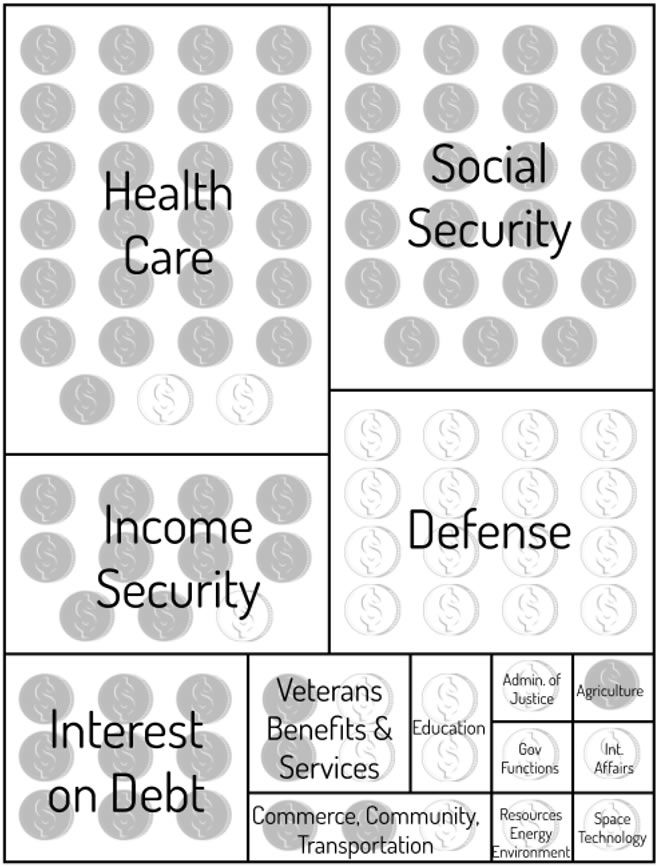
Visual 2-1: Budget Allocation (Actual)
Visual 2-2: Budget Allocation: Mandatory & Discretionary
Visual 2-3
Budget Allocations & Percentage of Total Spending 2019
Visual 2-3: Continued
Debbie Henney, FTE Director of Curriculum Receives Bessie B Moore Service Award
Foundation for Teaching Economics is proud to announce that Debbie Henney, director of curriculum for the Foundation for Teaching…

FTE Pays Tribute to Jerry Hume
It is with deep sadness that we announce the loss of William J. Hume, known as Jerry Hume, former Chairman…

Why We Should Be Teaching Students Economic Literacy
Ted Tucker, Executive Director, Foundation for Teaching Economics October 26, 2022 More high schools are offering courses on personal finance…