
Lesson 3: Is our Federal Debt Sustainable?
Download Lesson 3, Activity and Handouts
Lesson Overview
The federal debt of the United States has grown rapidly in recent years, and projections show that trend continuing. Should we be worried? Can we afford it? In this lesson, students will learn what factors drive that growth, how that debt compares to our nation’s income, and what kinds of things could make our debt levels sustainable or unsustainable.
Fiscal policy decisions (decisions about taxation and spending) are made by politicians. This activity puts students in the shoes of the decision-makers and tasks them with putting the federal budget on a sustainable course. After prioritizing their goals, students will explore possible policies, consider the costs and benefits of each and ultimately choose the policies that will best address their goals while bringing the debt to GDP ratio to a sustainable level. In comparing their choices and outcomes with other students in small groups, they’ll discover there are many alternative plans that could put the federal budget on a sustainable course, but all of them require costly decisions today.
Economic Concepts
- Debt
- Decision Making
- Deficit
- Economic Growth
- Expenditures
- Federal Reserve
- Fiscal Policy
- Gross Domestic Product
- Inflation
- Interest Rate
- Opportunity Cost
- Revenue
- Taxes
- Trade-off
Key Terms
- Mandatory spending
- Discretionary spending
- Congressional Budget Office
- Medicare
- Medicaid
- Baby Boomers
- Quantitative Easing
Objectives
Students will be able to:
- Distinguish between factors that will make the debt more or less sustainable.
- Provide examples of policies that could make the debt more sustainable.
- Identify opportunity costs of choices made today to make the future debt more sustainable.
Time Required
2 class periods (90 minutes)
Activity: Can you fix it? The Fiscal Ship
Procedures
Day 1
Use Lesson 3 Essential Understandings to introduce students to the concepts of sustainable and unsustainable debt.
ALTERNATIVE: Assign the Lesson 3 Essential Understandings as a student reading the day before running the Lesson 3 Activity: Can you fix it? The Fiscal Ship
Lesson 3 Essential Understandings
For years economists have worried about the long-run outlook of the U.S. debt and its impacts on the economy. As has already been discussed, the growing portion of the budget that is considered mandatory spending along with the aging of the population has heightened these concerns in recent years. This is in part due to the steep increases in the debt due to the Great Recession and the spending for healthcare and economic relief during the COVID-19 pandemic.
Other things have also been happening in recent years that provide cause to relook the issues of growing debt. These are steady economic growth and declining interest rates. Each of these plays importantly into the question of just how much debt is too much debt?
From the previous two lessons, we know that;
- The federal debt is on a path to reach unprecedented levels over the next few decades.
- Because of economic growth, the amount of debt as measured by the Debt to GDP ratio that can be supported over time is also rising.
- The federal government is a big part of the U.S. economy. Revenues from 1970-2019 averaged 17.4 percent of GDP while outlays averaged 20.4 percent of GDP.
- Due to the effects of the COVID-19 recession and spending, the outlays for 2020 are likely to jump to 30 percent of GDP while revenues will be much closer to 12 percent of GDP.
- The mandatory portion of federal expenditures is growing faster than the discretionary portion of the budget.
- Spending on things like financial relief to businesses and families, public health spending, and rebate checks to taxpayers due to the COVID-19 pandemic are likely to increase the federal debt by $2.4 trillion by the end of 2021.
- Looking at the debt as a percentage of GDP is perhaps the best way to compare the size of the debt to the size of the economy from year to year. This comparison not only lets us look at the debt relative to the size of the economy, but it also factors in any changes due to inflation changes in price levels.
- In 2007 the federal debt was $5 trillion, or 35 percent of GDP, and by 2019 the debt was $16.8 trillion, equal to about 79 percent of GDP. Over the preceding 50 years, federal debt averaged 42 percent of GDP, with the highest level being 106 percent in 1946.
Given what we know from the above and what we can observe in current government spending and programs, we can be assured that the federal debt will present challenges going forward. Just how big those challenges will be and how we choose to address them are still unknown.
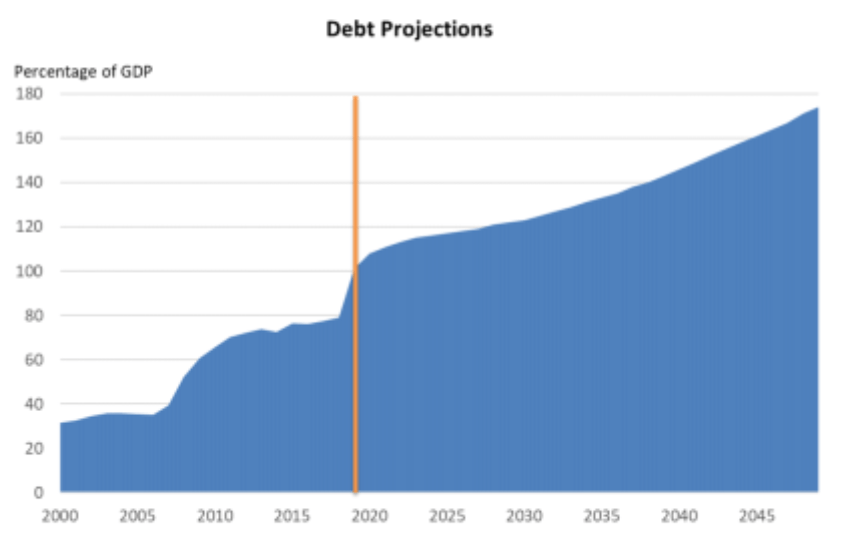
The Congressional Budget Office (CBO) projects federal deficits and debt in future years under so-called “baseline” assumptions about tax and spending policies; the assumption is generally that current laws will remain unchanged. (For the purposes of projecting discretionary spending over the long run, the CBO assumes that annual appropriations grow with GDP.) Under this baseline, federal deficits and debt are projected to be on a steady upward path going forward. While the CBO has not released new long-term budget projections since the pandemic, the following chart is probably in the right ballpark for what the post-pandemic projections will look like. (This guide will be updated when new projections become available.)
The projections show the debt climbing steadily following the sharp pandemic-induced jump. By 2030, debt will hit roughly 120 percent of GDP, and by 2050, about 180 percent of GDP. Of course, there is a great deal of uncertainty surrounding these projections—debt is affected by many factors that are hard to predict, including the level of interest rates and economic growth—but the fact that, without changes in law, debt will climb over time is fairly certain.
Hutchins Center on Fiscal & Monetary Policy
What is driving these changes?
There are two primary factors responsible for rising debt over time.
- Population aging. The population is in the midst of a demographic transition. The share of elderly in the population was 12 percent in 2000; today, it is 16 percent, and by 2030 it is projected to be 20 percent.
The rapid increase in the share of the elderly in the population is the result of the aging of the baby boom generation. The first baby boomers reached age 65 in 2011, and the last ones will hit 65 in 2029. But even once the baby boomers have passed away, the share of the elderly in the population won’t decline but will continue to increase, albeit at a slower pace.
Why is that? It is mostly about fertility and the fact that the number of children per family fell from roughly 3 to 2 per family after the baby boomers and is still falling. That, coupled with longer life expectancy, pushes up the percentage of older people in the population.
This means that entitlement spending will increase from a current 4.9 percent of GDP to a projected 6.4 percent of GDP by 2040.
- Rising health spending. Everyone complains about the high cost of health spending, and indeed, as a share of GDP, health spending has been increasing for decades. Most economists think that the increase in health spending isn’t the result of higher prices for the same type of health care but, instead, higher prices for better health care. Thus higher health expenditures mean that federal spending on health programs— mostly Medicare (the program for those ages 65+, and some younger people with certain disabilities) and Medicaid (the program for lower-income Americans) has continued to climb over time as well. Looking forward, continued rapid increases in health spending will continue to put pressure on federal budgets.
CBO projects that spending on the major health programs, which include Medicare and Medicaid, will rise to 9.3 percent of GDP in 2049 from 5.2 percent in 2019. Aging accounts for a third of that increase in spending, with the remainder due to rising health care expenditures per person.
Together, rising health spending and population aging mean that the federal budget will increasingly be an entitlements budget. The CBO projects that federal spending on people over 65 will account for half of all non-interest spending by 2040, up from 40 percent in 2019.
Is rising debt a problem?
Historically the idea of a rising national debt has always seemed like a negative to most people and to most economists. This has a lot to do with how we feel about our own, or what we call private debt. We know we must repay it at some point in time, even if it is at our death and paid from our assets. However, this is not true for federal debt, people die, but governments can last forever. The federal debt is passed from generation to generation.
Still, there have been, and remain, a number of concerns about having a large or rising federal debt.
One concern is that federal borrowing will “crowd out” private borrowing that could have gone into private investment in machines, computers, research and development, etc. This happens if the federal borrowing pushes up interest rates to a level that private borrows choose not to borrow and invest. This can curtail increases in private investment spending that bring about increases in productivity and economic growth.
It is important to note in this scenario that it is private investment spending that is being crowded out, but if we are using the borrowed federal money for government investment in roads, ports, or even research and development, we might get the same kind of productivity and economic gains.
Other concerns about high levels of federal debt are the confidence of potential borrowers in the ability of the government to pay the borrowing back and if the government has the capacity to borrow large sums in the future if an emergency like COVID arises.
A question that is often asked is, “just how high can the debt get before we get into real trouble?” The truth is no one knows. But it is clear that debt cannot continue to climb forever.
Another consideration in answering the question of how much debt is sustainable is whether the goal is to bring down, or manage, the absolute amount of the debt or to manage the level of the debt to GDP ratio. Oftentimes policymakers, individuals, and even economists who talk about bringing down the debt are actually only concerned with bringing down the debt to GDP ratio. Either way, it is likely that changes to taxing and spending policies will have to change to rein in the deficits and stabilize the debt unless the economy can grow fast enough that a large increase in GDP growth could lower the debt to GDP ratio.
Paying down the debt and sustaining the level of debt are very different objectives, and each calls for different policy goals and actions. If the country is going to pay down the debt, it will mean having annual surpluses instead of annual deficits, where the government takes in more money than it spends. This would mean less government spending or higher revenues through increased taxes, or a combination of both.
But what about keeping the debt to GDP percentage at a level that is sustainable over a very long period of time? After all, that is essentially what we have done at an average of about 40 percent for the past 80 years. The two factors in determining that ratio are the size of the annual deficit and the level of annual GDP growth. If the growth of the economy is greater than the deficit, then the debt to GDP ratio will fall. And if not, the ratio will rise. The level/rate of economic growth is key to keeping debt to GDP percentages at a sustainable level. Thus it is not enough to focus on spending and taxing levels, but policies that promote economic growth must also be considered.
What is the role of the Federal Reserve in purchasing and managing the Federal Debt? Will it create inflation?
Debt held by the public excludes debt held in intergovernmental funds like the Social Security trust fund, but it includes debt held by the Federal Reserve. Just how much debt does the Fed hold?
To limit the economic damage done by the pandemic, the Federal Reserve—the central bank of the United States–began purchasing hundreds of billions of dollars of Treasury debt securities from investor banks as it did in 2008. This practice is known as quantitative easing or QE. Even though the Fed isn’t lending money directly to the Treasury, by purchasing Treasury securities from investor banks, they lower the interest rate on Treasury debt in the market and thereby lower the interest rate that the Treasury, and others, has to pay to borrow.
Between mid-March 2020 and the beginning of July 2020, the Fed’s portfolio of long-term Treasury securities rose by $1½ trillion. Over this same period, the Treasury borrowed about $3 trillion. In essence, the Fed bought about ½ of the additional Treasury securities issued to finance the increase in the debt.
When the Fed buys Treasuries, they still do so at the prevailing interest rate, but their willingness to purchase at a lower interest rate holds the rate down for the entire loanable funds market. And, since the Fed manages interest rates with its monetary policy, they can work to keep the interest rate low.
Some fear that the quantitative easing that the Fed purchase kicks off could contribute to inflation as the cost of borrowing is kept low. However, because the Fed can move to increase interest rates and thereby slow investment and spending, it is unlikely that their Treasuries purchases themselves would lead to increased inflation.
What are the implications of government debt in a low-interest-rate environment?
One of the most striking changes in the economy over the several years is the steady decline in interest rates on government debt and other assets. This decline has been steady over recent decades and has resulted in a 0% or near 0% interest rate on Treasuries. This is illustrated in the graph below.
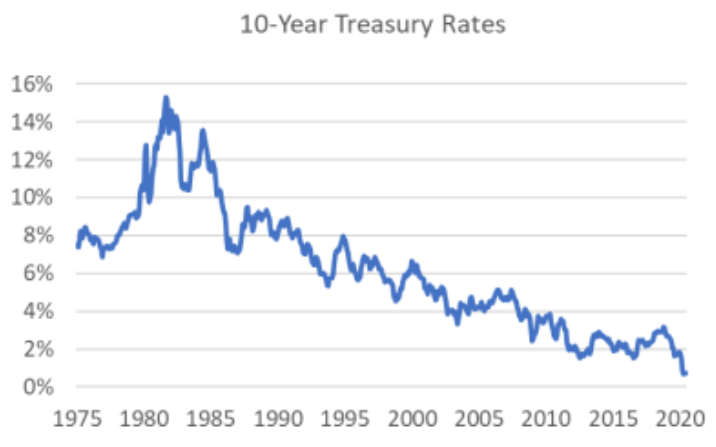
Some of this decline represents falling inflation. But real rates (adjusted for inflation) have declined as well. For example, as shown below, the rate on 30-year Treasury Inflation-Indexed Securities (or “TIPS.” These are securities that are adjusted by the changes in consumer price inflation in order to yield a guaranteed real rate of return) has declined from over 2 percent in 2010, to 1.5 percent by 2014, and to -0.3 percent in July of 2020. (A negative rate means that someone lending the government money will get back less money in inflation-adjusted dollars than they lent.)
These low interest rates drastically change the calculations of the cost of debt. Indeed, with interest rates this low, some claim that debt is “free.”
Is debt free?
How could debt be free? If the government can borrow today, spend the money, and never have to raise taxes or lower spending in the future to pay it back, it might be considered free. That is because there is no trade-off, or opportunity cost, between taxpayers today spending the money and taxpayers tomorrow having to pay it back.
Using the Debt to GDP ratio as the measure of the size of the debt, the condition for debt to be “free” is for the interest rate to be less than the growth rate of the economy. Federal governments are not like households. Because governments can go on forever, they don’t have to pay down or pay off debt. So far, we have considered debt to be sustainable so long as it isn’t growing as a share of GDP. So, the total amount of debt can grow by the growth rate of the economy, and debt as a share of the economy will remain stable. What that means is that the government doesn’t have to pay all the interest on the debt; it just has to pay the interest on it (“r”) less the rate of economic growth (“g”). And in fact, because most of the debt is financed with relatively short-term Treasuries, we are actually “re-financing” previous year’s deficits at lower interest rates and, therefore, lower cost.
The table below goes through a very simple example that shows what happens to the ratio of debt to GDP when the government borrows $100 and then keeps borrowing money to pay the interest on the debt—i.e., the government borrows money and then doesn’t lower spending or raise taxes to service the debt. The table illustrates three cases of interest rate and GDP growth rate.
In the third case of a 2% interest rate and a 3% GDP growth, the debt to GDP ratio is actually falling even as the government continues to borrow. This might be the situation we will face in the coming years. Indeed, in CBO’s latest post-pandemic 10-year economic projection, the rate on the 10-year Treasury is below the growth rate of the economy every year from 2021 to 2030.
What are the policy implications of low-cost debt?
Although at current interest rates, debt appears free or close to free, most economists are not advocating a wholesale abandonment of budget constraints. While most indicators are that interest rates will remain low for quite a while, such an outcome is not guaranteed. Just because interest rates have fallen for years for reasons that economics can’t fully explain, that doesn’t mean that they will stay low forever; they could very well increase in the future. In addition, if deficits continue to mount and the government must borrow more and more is likely that interest rates will begin to climb as well.
But the fact that rates are so low despite the recent increase in debt does mean that the amount of debt that the U.S. can safely sustain is much larger than people used to think. That means we have more “room” to borrow without ‘crowding out’ private investment, we have more debt capacity to respond to emergencies like COVID-19, and we have some room for either increasing public investment or lowering taxes on individuals and corporations. All of which should contribute to GDP growth that helps keep the debt to GDP ratio sustainable.
Conclusions
The Federal debt has exploded in recent years to levels never seen before. In addition, structural changes in the economy—mainly related to population aging and continued increases in health spending—mean that the debt is likely to only continue to increase unless policymakers raise taxes or cut spending.
Even though the level of debt has steadily increased because of the growth of the economy, the ratio of the debt to GDP has remained relatively constant until the past year or two. The debt to GDP ratio perhaps speaks to the question of debt sustainability better than the absolute size of the debt.
Despite an unprecedented rise in the debt, interest rates have been falling, and real interest rates are now negative. This suggests that the sustainability of the debt is much less daunting a problem than used to be the case. At low and sustained low interest rates, the investment in and growth of the economy can be the way to keep the debt sustainable.
However, changes in spending and taxes will eventually be necessary, but when interest rates are low, it may not be the time for policymakers to make those changes when the spending can promote economic growth and improve the lives of our citizens.
Sources
Baier, Scott and Benjamin Posmanick. “Federal Debts and Deficits: Past, Present and Future.” Foundation for Teaching Economics, 2020, www.fte.org.
Capretta, James C. “Fiscal Policy and the Major Entitlements: An Introduction.” Foundation for Teaching Economics, 2020, www.fte.org.
Sheiner, Louise and Kadija Yilla. “Federal Debt Policy in an Era of Low Interest Rates: A Guide to the Issues.” Brookings Institution, 2020, www.brookings.edu.
Handout 3-1: My Governing Goal Priorities
DIRECTIONS: Which of the governing goals below are most important to you? Rank the list from 1-10, with #1 being the most important to you.
| Rank | Governing Goals | |
| Invest in the Future | “Invest now for rewards later”
“Improve our roads and airports” “Invest in innovation” |
|
| Fight Climate Change | “Save the Planet”
“Reduce our carbon footprint” “Stop global warming” |
|
| Tax Cutter | “Keep more of what you earn”
“Tax cuts spur growth” “Will work harder for lower taxes” |
|
| Reduce Inequality | “What about the 99%”
“We’re too rich to accept poverty” “Share the wealth” |
|
| Shrink Government | “Government is best which governs least”
“End tax and spend” “Smaller government = smarter government” |
|
| Protect the Elderly | “Honor our senior citizens”
“Keep our promises” “Retire with security and dignity” |
|
| Fiscal Hawk | “Lower future debt, greater future opportunity”
“We’re borrowing from the future” “Live within our means” |
|
| Strengthen National Defense | “Peace through Strength”
“Protect our global leadership” “Support our Troops” |
|
| Strengthen Social Safety Net | “Protect the vulnerable”
“A society is only as strong as its weakest link” “A helping hand to those in need” |
|
| Rein in Entitlements | “We all need to tighten our belts”
“Good health care shouldn’t cost so much” “Promote greater self-sufficiency” |
|
Handout 3-2: Fiscal Ship Game & Reflection
PART I
Play The Fiscal Ship game at www.fiscalship.org. Use your top 3 goals from Handout 1 as your goals for the game. Save your results by clicking on the disc (save) button and record your GameID below. Answer the questions below based on your experience playing the game.
My GameID: __________________________________
Individual Reflection Questions
- What trade-offs did you face in the game?
- Identify a choice you made in the game and the opportunity cost of that choice.
- Share a policy that you chose to enact. Who benefited from the policy? Who bore the costs of the policy?
- How did your values impact your goals and the choices you made throughout the game.
PART II
With your assigned team, fill out the table and discuss the questions on the next page.
| Role | Team Member Name | Saved Fiscal Ship GameID |
| Discussion Leader: Ask questions, elicit responses from all members, and contribute to the discussion. | ||
| Recorder: Record the team’s responses to the discussion questions below. | ||
| Game Navigator: Navigate The Fiscal Ship Game website: http://fiscalship.org/ Choose “Compare Plans” on the homepage and use GameIDs to load team members’ plans for comparison and display during the discussion. |
Handout 3-2 (continued)
Group Discussion Questions
- Compare the choices made and opportunity costs borne by members of your team. How were those choices and opportunity costs similar/different?
- Compare some of the policies chosen by team members and discuss who benefits and who bears the cost. Are there any interesting similarities, contrasts, or conclusions you can draw from this comparison?
- Were some goals harder/easier to meet than others? Which ones and why?
Handout 3-3: Fiscal Ship Policy Options
DIRECTIONS: Use this list as a guide as you are reviewing and selecting policies to include in your plan while playing the Fiscal Ship Game.
ARTS & SCIENCES
- Boost National Science Foundation funding
- Cut National Institutes of Health funding
- Cut National Science Foundation funding
- End human space exploration
- Increase funding for arts and humanities
- Increase NASA budget
- Increase National Institutes of Health budget
- Reduce funding for arts and humanities
CHILDREN & FAMILIES
- Block grant and cut food stamps
- Expand Earned Income Tax Credit
- Expand housing aid for poor
- Expand the child tax credit
- Increase childcare subsidies
- Paid family leave
- Preschool for four-year-olds
- Tighten eligibility for food stamps
CORPORATE TAXES
- Cut corporate tax rate, close some loopholes
- Increase corporate tax rate
- Reduce taxes on international profits
- Set minimum tax on foreign profits
FOOD & AGRICULTURE
- Block grant and cut food stamps
- Double FDA funding
- Reduce farm subsidies
- Tax sugary drinks
- Tighten eligibility for food stamps
DEFENSE & FOREIGN AFFAIRS
- Build fewer submarines
- Cancel new aircraft carrier construction
- Cut active-duty Army by half
- Cut foreign aid Expand U.S. Navy fleet
- Increase active duty Army
- Increase defense R&D spending
- Increase foreign aid
- Kill F-35 Joint Strike Fighter
EDUCATION
- Eliminate student loan subsidies
- Eliminate the Department of Education
- Free tuition at public colleges
- Limit Pell grants to neediest students
- Preschool for four-year-olds
- Slash interest rates on existing student debt
- Two years of community college tuition-free
ENERGY & ENVIRONMENT
- Double the EPA’s budget
- Eliminate renewable fuel subsidies
- Eliminate the EPA
- End tax breaks for fossil fuels
- Extend renewable energy tax credits
- Impose a carbon tax
- Increase the gas tax
TAXES ON INVESTMENTS
- Cut taxes on investment income
- End tax on capital gains, interest, dividends
- Impose new tax on financial transactions
- Increase tax on capital gains and dividends
- Tax carried interest as ordinary income
INFRASTRUCTURE & TRANSPORTATION
- Cut infrastructure spending
- Double subsidies for Amtrak
- Eliminate funding for Amtrak
- Increase infrastructure spending
HEALTH
- Boost access to generic drugs
- Boost Medicare Advantage competition
- Bundle Medicare payments for post-acute care
- Cap Medicaid payments to states
- Cap Medicare spending
- Convert Medicare to “premium support”
- Cut National Institutes of Health funding
- Increase Medicare premiums
- Increase National Institutes of Health budget
- Increase taxes on cigarettes
- Means test Medicare
- Raise Medicare eligibility age
- Raise Medicare out-of-pocket costs
- Reduce what Medicare pays for drugs
- Reform malpractice laws
- Repeal Cadillac tax on costly health plans
- Repeal Obamacare’s insurance expansions
- Use income taxes to fund Medicare
INCOME & PAYROLL TAXES
- Reduce income tax rates, consolidate brackets
- Boost taxes on the super-rich
- Eliminate cap on wages subject to payroll tax
- Implement a 15% flat income tax
- Increase all income tax rates
- Increase Medicare payroll tax
- Increase Social Security payroll tax
- Lower the inflation adjustment for taxes
- Raise taxes on $150,000+ folks
- Raise taxes only on $400,000+ folks
- Use income taxes to fund Medicare
- Use income taxes to fund Social Security
LABOR & EMPLOYMENT
- Expand unemployment benefits
- Reduce federal employees’ pensions
- Reduce federal employment through attrition
- Slow increases in government pay
LAW & ORDER
- Cut spending on law enforcement
- Enact immigration reform
- Increase Homeland Security spending
- Reduce Homeland Security spending
- Spend more on law enforcement
OTHER TAXES
- Eliminate the estate tax
- Extend renewable energy tax credits
- Impose a carbon tax
- Impose a value-added tax
- Increase taxes on cigarettes
- Increase the estate tax
- Increase the gas tax
- Repeal Cadillac tax on costly health plans
- Tax sugary drinks
SOCIAL SECURITY
- Boost low-wage workers’ Social Security
- Boost Social Security benefits for very old
- Cut Social Security COLA
- Increase Social Security eligibility age
- Lower the COLA for all spending programs
- Reduce Social Security benefits
- Use income taxes to fund Social Security
TAX CREDITS & DEDUCTIONS
- End tax breaks for fossil fuels
- Convert mortgage interest deduction to credit
- Curtail charitable deduction
- Eliminate renewable fuel subsidies
- Eliminate state and local tax deductions
- Expand Earned Income Tax Credit
- Expand the child tax credit
- Raise the standard deduction

Debbie Henney, FTE Director of Curriculum Receives Bessie B Moore Service Award
Foundation for Teaching Economics is proud to announce that Debbie Henney, director of curriculum for the Foundation for Teaching…

FTE Pays Tribute to Jerry Hume
It is with deep sadness that we announce the loss of William J. Hume, known as Jerry Hume, former Chairman…

Why We Should Be Teaching Students Economic Literacy
Ted Tucker, Executive Director, Foundation for Teaching Economics October 26, 2022 More high schools are offering courses on personal finance…