
Lesson 4: Where are the Numbers? – Tracking the Words and Tracking the Deeds

Lesson Overview
An African proverb says, “when deeds speak, words mean nothing,” or more familiarly, “actions speak louder than words.” In the case of fiscal policy in the United States, those deeds are the Financial Report of the U.S. Government, and the words are the federal budget. But unfortunately, these deeds rarely speak. In fact, when the financial report is released each year, you can hear a pin drop. Meanwhile, the budget for the upcoming year is met with fanfare and media attention. Why? This lesson decodes the language of financial reports to give “voice” to the deeds of government. In the accompanying activity, students compare a recent budget with the financial report for the same year to find out how well our government’s deeds match their words.
Key Terms & Economic Concepts
- Assets
- Balance Sheet
- Budget
- Deficit
- Financial Statement
- Functions of Money
- Liabilities
- Money
Objectives
Students will be able to:
- Explain the difference between a budget and a balance sheet
- Identify the basic components of a balance sheet
- Explain the complicating factors regarding the balance sheets of the federal government
- Compare and Contrast a federal budget and a financial report from the same year.
Time Required
2 Class Periods (90 minutes)
Activity: Tracking the Words and Deeds
Procedures
Day 1
Use the Lesson 4 Key Points to teach the difference between budgets and financial statements as well as the complicating factors specific to the financial reports of the United States.
Alternative: Assign the Lesson 4 Key Points as a student reading before running this “Tracking the Words and Deeds” activity.
Lesson 4 Essential Understandings
Government plays an important role in the U.S. economy, be it for good or bad or perhaps both. Government matters through its fiscal and monetary policies and through its expenditures and programs.
The Gross Domestic Product (GDP) is made up each year of the sum of consumer spending plus private investment plus government spending plus or minus imports. (C=I+G+NX=GDP) In 2019, even before all of the COVID relief spending, total government spending of local, state, and federal governments amounted to nearly $3.8 trillion, almost 20% of nominal GDP. State and local spending represent about two-thirds of that $3.8 trillion.
Government spending at all levels is a big part of our economy, but the money spent by governments does not come out of thin air. Americans pay for their governments through income, sales, property, payroll, Social Security, Medicare, and other taxes. And in addition, the government at all levels borrows to pay for a portion of the expenses. Borrowing can come from citizens and corporations in the U. S. as well as from foreign sources.
Citizens, taxpayers of every type, and creditors want to know what the financial strength of the country is. Just as in a private business, we want to know if at the end of the year there has been a positive or negative outcome and if the business or government holds more assets than liabilities. The way to answer these questions is to look at the financial reporting of businesses or the government.
Financial reports of both businesses and governments can include many documents and varying levels of specificity, but for our analysis, we will discuss the summary reports of budgets and financial statements.
The Value of Money & Financial Reports
While the government can spend money on thousands of different items ranging from the Presidents’ salary to paper clips for the department of education or a tank for the military, the values of all of those items are stated in dollar terms on financial reports. This may seem simple enough, but the functions that money serves – being a medium of exchange, a store of value, and a unit of account – are all important as we consider financial reporting.
A dollar is effective as a medium of exchange only so long as people accept it in payment for goods and services. Imagine accounting for transactions or exchanges if we lived in a barter economy—what would economic reporting look like. A dollar serves as a store of value, meaning I can spend a dollar on, say, a donut today or keep the dollar in my pocket, storing that value for another day, and buy the donut tomorrow. Thus financial reports represent a level of stored value. A dollar serves as a unit of account; it is this function of money that helps us to literally compare apples and oranges or tanks and paperclips on financial reports.
Because financial reports are always presented as a point or period in time (more about this later), the function of money as a store of value must be tempered by the value of money over time. To accurately consider a government’s financial position, we need to answer the question of “what is worth more—a dollar today or a dollar tomorrow?” The answer: a dollar today is worth more than a dollar tomorrow or stated in financial terms, the present value of a dollar is greater than the future value of a dollar. This is because a dollar today gives you the value of its use today, be it an ice cream cone, investment in a machine or education, or just the security of knowing you have it. A dollar tomorrow is never a sure thing; there is the risk that the dollar will buy less, rules may change, opportunities or alternatives may change, or even that one’s health might change that would mean you get less value for your dollar.
So a dollar in the future is worth less than a dollar in the present, but that does not mean it is worth zero in the future. The perceived value or a future dollar is a present dollar times some discount for the uncertainty of the future. This present versus the future value of a dollar does become important in government borrowing and consequently how that borrowing or future government obligations are accounted for and reported.
There are a whole series or list of accounting terms and procedures that we would need to cover to have complete and in-depth knowledge of government financial reports. However, this lesson will focus on the importance of, and sometimes shortcomings of, government budgets and summary financial reports.
Financial Reporting – A Constitutional Mandate
The federal government and each state government are mandated by their respective constitutions to approve budgets, make expenditures and issue financial reports. For the federal government, the spending authority is vested in the Congress of the United States. The executive branch, under the President, executes the law. Article I articulates the legislative powers, vesting them in Congress. Article I, Section 9 is known as the “Statement and Account Clause.”
“No money shall be drawn from the Treasury, but in Consequence of Appropriations made by Law; and a regular Statement and Account of the Receipts and Expenditures of all public Money shall be published from time to time.”
How well has the federal government lived up to this constitutional principle? And how well do state and local governments discharge similar duties for their taxpayers? As good citizens, we all should have a basic awareness and understanding of these government duties and just how well they are discharged.
Each year the federal government produces a budget and a financial report which includes detailed and audited financial statements.
Budgets and the Budget Process
The budget is a forward-looking document that identifies both expenses and revenues for the coming year. The Congressional Budget Act of 1974 gives the President the “first crack” at developing the budget. Early in the calendar year, the President develops a budget request after canvassing all the departments in the executive branch and submits that request to Congress. The budget is for the next fiscal year, which begins October 1st.
The spending covered by the budget includes both the mandatory and discretionary spending items. The President can make recommendations for policy changes to mandatory programs, but spending for them must be included as estimated to be required by law. On the discretionary programs, the President can make budget requests that do not need a change in the law to enact. The President’s budget report is a request to Congress rather than a directive because any expenditure, either mandatory or discretionary, must be approved by Congress and appropriations bills passed before money can be spent.
The next step in the process is the development of a Congressional Budget Resolution that is undertaken by the House and Senate Budget Committees. They each develop their own versions and send them to the House and Senate floors for a vote. From there, any differences in the house and senate versions are resolved in a joint conference committee, and a common bill is sent to both the House and Senate.
The Budget resolution is not a formal bill that results in a law, and it does not require the President’s signature. It does, however, require that an analysis be done by the Congressional Budget Office that provides projections on surpluses or deficits for the next ten years.
Once the budget resolution is adopted, the nitty-gritty follows, which involves enacting actual budget legislation. Budget legislation is a series of appropriations bills, which are formal laws that determine government spending and must be signed by the President. Appropriations bills set limits on spending, but in addition to those, Congress has passed overarching constraints on total spending contemplated in the Budget. Violation of those laws can lead to “sequestration,” which is across the board cuts in spending.
In addition to the spending limits, Congress has, since World War I, set debt ceiling limits to constrain the borrowing of the federal government. We have seen in recent years that these limits are limits until congress votes for them not to be. The debt ceiling has been raised 20 times since the mid-1990s. Currently, the debt ceiling has been suspended through mid-2021.
It is important to note that none of this process nor ceilings precludes Congress from passing an appropriations bill that is outside or beyond the recommendations of the budget or a debt ceiling at any time during the year. The COVID relief bills are examples of this.
Financial Reports
Such is the budget process, but what about financial reports on the nation’s performance against the budget? The documents are a part of the Financial Report of the U.S. Government. Unfortunately, or perhaps, fortunately, depending on one’s perspective, the Financial Report of the U.S. Government appears approximately 2 years behind the budget request. For instance, the Financial Report for the fiscal year 2019 was released as the President’s budget for 2021 was nearly ready for release. And the release of the report seldom gets the attention of the proposed additions or cuts to the President’s budget request.
The main financial statements of the government which report on the results of expenditures and revenues are:
- Statement of Net Cost
- Statement of Operations and Changes in Net Position
- Reconciliation of Net Operating Cost and Budget Deficit
- Balance Sheet
- Statements on Social Insurance
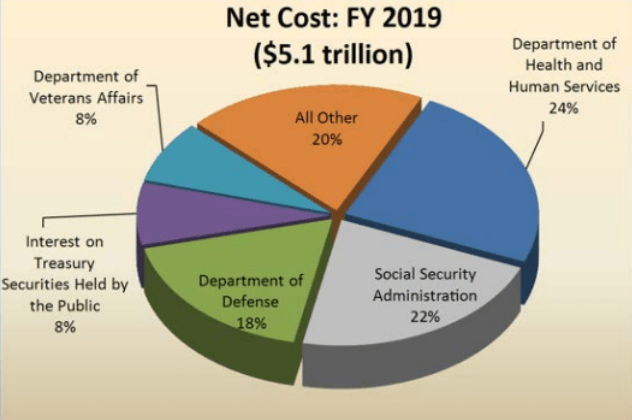
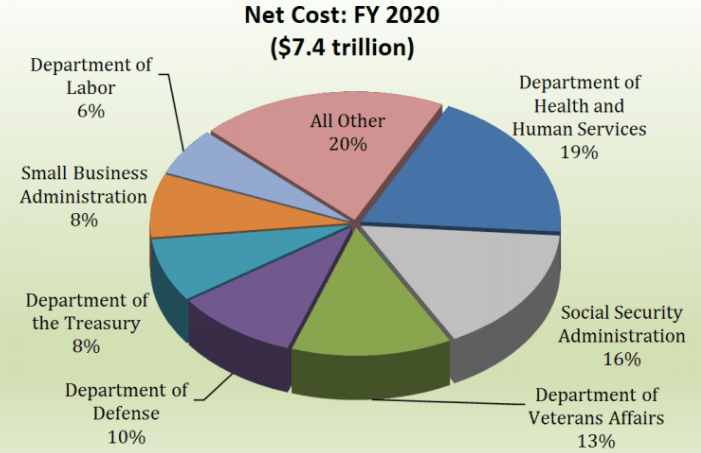
In the Statement of Net Cost, costs are accumulated and totaled for more than 40 agencies and line items. They are adjusted for any revenue earned from charges for services and changes in accounting assumptions.
The four agencies costing the most in 2019 were, in order, the Department of Health and Human Services, the Social Security Administration, the Department of Veterans Affairs, and the Department of Defense. If Defense and Veterans Affairs are combined, they become the single largest item. These four agencies account for more than 2/3rds of the cost of the entire federal government. The fifth-largest line item is not an agency; it is titled “Interest on Treasury Securities Held by the Public.”
The net costs become the basis for the Statement of Operations and Changes in Net Position—the federal government’s version of an income statement. This statement, like a private business statement, reflects performance over a period of time, usually a fiscal year.
First listed are various sources of government revenues, things like individual income tax and tax withholding, corporate income taxes, excise taxes, unemployment taxes, custom duties, estate and gift taxes, and some other small line items. Income tax and tax withholding (which includes Social Security taxes) are by far the largest source of revenue.
Below the revenue section is the “Net Cost of Government Operations,” based on the Statement of Net Cost. The costs are then subtracted from the revenues to give a “bottom line” or “Net operating (cost)/revenue.” The parentheses mean that cost exceeded revenue leading to a government shortfall or deficit. This has been the case for the last decade and beyond.
Oftentimes the surplus or deficit (and they have mostly been deficits) anticipated in the Congressional Budget by the CBO analysis is far below the actual deficit incurred by the government. This is usually due to the fact the actual expenditures are voted on and approved after the budget resolution has been passed and the CBO analysis has been done.
While the Statement of Operations and Changes in Net Position shows how the government performed over time and whether or not it had a net loss or gain (surplus or deficit), the Balance Sheet, which we examine next, reports on a point in time, usually the last day of a fiscal year), and compares the assets and liabilities of the government at that point.
Balance Sheet
The federal government of the U.S. may be the largest and most complicated financial organization in world history, but it reports an amazingly short and simple balance sheet—perhaps a little too short and simple. There are assets, liabilities, and net position categories. There are eight categories of assets, eight categories of liabilities, and two components to the net position—the “residual Claim,” or what is left, more assets or more liabilities. The entire statement, presented for the end of the latest accounting period, takes up a little more than half a page in the report.
The federal balance sheet is short and simple and glaringly reports a mountain of liabilities in the form of debt, lots, and lots of debt. Yet, it still fails to include some of the largest debts of all.
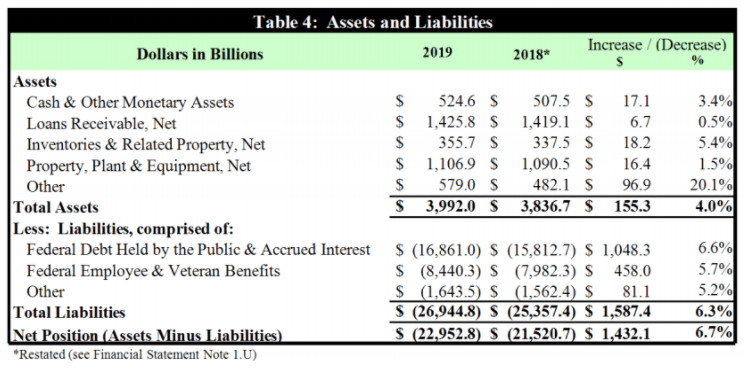
In the fiscal year 2019, the federal government reported $4.0 trillion in total assets. The largest of the eight asset components was $1.4 trillion in “loans receivable, net”—this is primarily student loans. Many people feel that not nearly all of those loans will be repaid and should not be listed at face value. The second largest component is government-owned property, plant, and equipment at $1.1 trillion—less than the student loans the government holds.
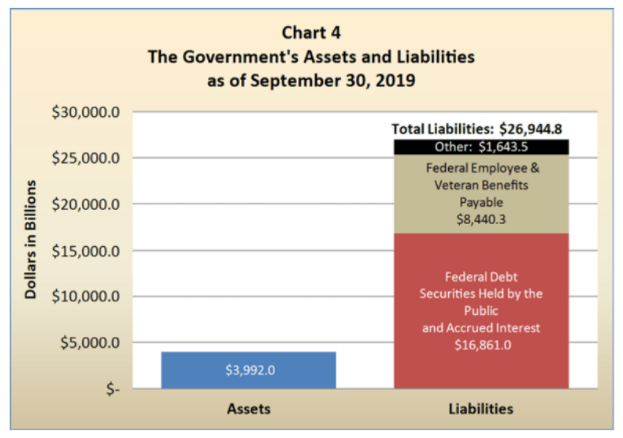
As we move down the balance sheet to liabilities, we find that the $4.0 trillion in assets is swamped by the $26.9 trillion in liabilities reported by the federal government. This leads to a net position of (negative) $23 trillion.
Just what do those $27 trillion in liabilities include? Treasury debt securities “held by the public” account for nearly two-thirds of them. Nearly $17 trillion in Treasury debt was reported in liabilities in 2019. Treasury debt is the bonds, notes, and bills the Treasury issues to borrow money when we run a deficit.
The second largest category is also very large at $8.4 trillion—“Federal employee and veteran benefits payable,” this is a government employee and veteran retirement pension, medical care, and other benefits.
The following table and chart provide an overview of the 2019 balance sheet.
2019 Financial Report of the U.S. Government
2019 Financial Report of the U.S. Government
The “Federal employee and veteran benefits payable” amount is the present value of future benefits like pension and health care services promised to government employees. Remember the present value is based on an estimate of the future value of the liability.
A little further down the balance sheet, you will see a line item titled “Benefits Due and Payable.” At just $224 billion, this line item is less than 3% of the “Federal Employee and Veteran Benefits Payable” amount. The content of the much-smaller “Benefits Due and Payable” is disclosed in a footnote to the financial statements. It is a very important footnote because it discloses that “Benefits Due” relates to Social Security and Federal Disability Insurance.
Together these two items total only $100 billion. How can a huge program like Social Security seem tiny when compared to the liabilities the government reports for retirement benefits of just government employees? The Social Security program is not tiny; just the balance sheet entry is tiny.
If we examine the Statements of Social Insurance which provides a “point in time” financial position for Social Security and Medicare, we find that the projected liabilities for these programs are extremely large, yet they do not show up on the federal balance sheet. In 2019, Social Security expenditures came to $87.2 trillion, and the present value of revenue was only $70.4 trillion leaving a ($16.8 trillion) negative net present value position for the program. When this is put together with the negative position of Medicare, it leaves a massive ($59.1 trillion) projected liability for the programs.
This ($59.1 trillion) liability is massively larger than the reported national debt of $26 trillion, but it does not show up on the federal balance sheet. How can that be so? It is because these are projected liabilities under the present law, and because the government controls the law, the law can change at any time and therefore change the size of the liability.
Yes, the government makes the law and can change the law. But many believe that a strong argument can be made that as long as current law leads to shortfalls in the financial positions for Social Security and Medicare, the value of those unfunded obligations should be included on the balance sheet until the law is changed.
Who checks the books?
Just as with a private business, government financial statements are subject to an independent audit to see if everything was properly accounted for. For the federal government, this task is undertaken by the Government Accountability Office (GAO). The audits contain a final opinion by the auditors as to whether or not the statements fairly present the financial condition of the government in accordance with generally accepted accounting principles.
The GAO delivers the opinion as a part of the financial audit. The opinions that can be issued range from “unmodified” (all is in order as it should be) to “disclaimer” (a flunk-like opinion that the finances are not in order). The GAO has delivered a “disclaimer” opinion every year since the annual report has been issued in its modern format, which dates to the late 1990s. In 2019, the opinion emphasized issues of “long-standing and deeply rooted problems in Defense Department accounting practices, unreliable information relating to balances due and owing between different entities within the government, and weaknesses in the processes used to aggregate information from individual agencies.
The overall federal audit depends on extensive audits at individual agency levels. In 2019, as in previous years, the Defense Department Office of Inspector General delivered a “disclaimer” opinion on that agency’s statements. In part, the GAO statement on the DOD read, “The disclaimers of opinion were partially based on the disclaimers of opinion for multiple DOD components, including the Army, Navy, Air Force, U.S. Marine Corps, Defense Health Program, Defense Logistics Agency, U.S. Transportation Command and U.S. Special Operations Command.” The DOD is central to the federal government’s inability to secure an “unmodified” audit opinion for its overall financial statements.”
Conclusion
The annual GAO opinion letter and the Statement of the Comptroller General have gone beyond assessing the reliability of federal government accounting in recent years. There is now concern expressed about the fundamental sustainability of the U.S. government’s fiscal future. These concerns are driven, in large part by the large, yet still unstated, size of the unfunded liabilities of Social Security and Medicare. The GAO has deemed this level of liability to be “unsustainable.”
In introducing the balance in the financial statements, the federal government gives us the following two sentences:
“There are, however, other significant resources available to the government beyond the assets presented in these Balance Sheets. Those resources include the Stewardship Land and Heritage Assets in addition to the government’s sovereign powers to tax and to set monetary policy.”
So there are resources to alleviate concerns of liability-heavy balance sheets, and there is the power to “tax and to set monetary policy.” One that takes people’s money directly and one that takes it through increased inflation.
Sources
Bergman, Bill. “Government Financial Reporting in the United States.” Foundation for Teaching Economics, 2020, www.fte.org
Congressional Budget Office. (2020). The Budget and Economic Outlook: 2020-2030. https://www.cbo.gov/publication/56020
Department of Treasury. (2020). Financial Report of the United States Government FY2019. https://www.fiscal.treasury.gov/files/reports-statements/financial-report/2019/FR-02272020(Final).pdf
Department of Treasury. (2021). Financial Report of the United States Government FY2020. https://www.fiscal.treasury.gov/files/reports-statements/financial-report/2019/FR-02272020(Final).pdf
Handout 4-1: Comparing the Federal Budget and Financial Report
Directions:
Use the links or visuals provided by your instructor to compare the planned spending and revenue in the U.S. Federal Budget with the actual spending and revenue in the U.S. Financial Report. HINT: In the Financial Report, you are given a total dollar amount of spending and the percentage of a total Spending for specific budget categories. Multiply the total by the percentage to come up with a dollar amount of spending for a given category. Example: 37% of $5000: .37 x $5000 = $1850.
Spending
| Planned (Budget)Dollars | Actual (Financial Report)Dollars | |
| Social Security | ||
| Medicare/Medicaid (Dept of Health and Human Services) | ||
| Defense | ||
| Interest on the Debt | ||
| Other | ||
| Total |
Revenue
| Planned (Budget)Dollars | Actual (Financial Report)Dollars | |
| Individual Income Taxes | ||
| Payroll Taxes (Tax Withholdings) | ||
| Corporate Income Taxes | ||
| Other Revenue | ||
| Total |
Handout 4-1 (continued)
Deficit/Surplus
| Planned (Budget)Dollars | Actual (Financial Report)Dollars | |
| Revenue | + | + |
| Spending | – | – |
| Total |
Questions
- For which categories was spending greater than planned?
- For which category was spending less than planned?
- Which spending category was over budget by the greatest amount?
- Which revenue categories were greater than expected?
- Which revenue categories were less than expected?
- What types of revenue might be included in the “other” category?
- Overall, how does the financial report you reviewed compare to the budget?
- Which do you think is easier, increasing federal revenue or decreasing federal spending? Why?
- When the financial report is released for THIS fiscal year, how do you think the actual spending and revenue will compare to the budget? Why?
Visual 4-1: Federal Budget of the U.S. Government 2019
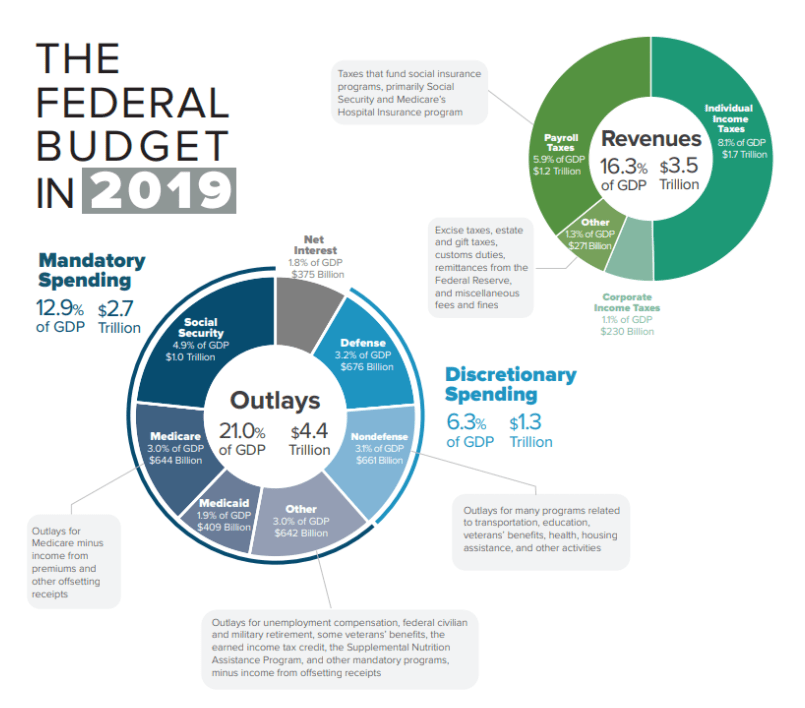
Congressional Budget Office
Visual 4-2: Financial Report of the U.S. Government 2019
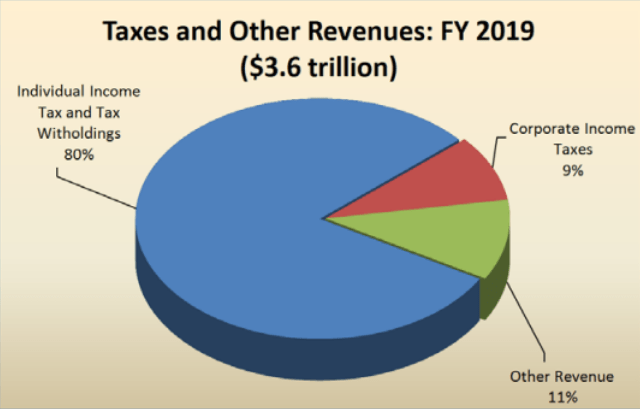
2019 Financial Report of the U.S. Government
Visual 4-3: Federal Budget of the U.S. Government 2020
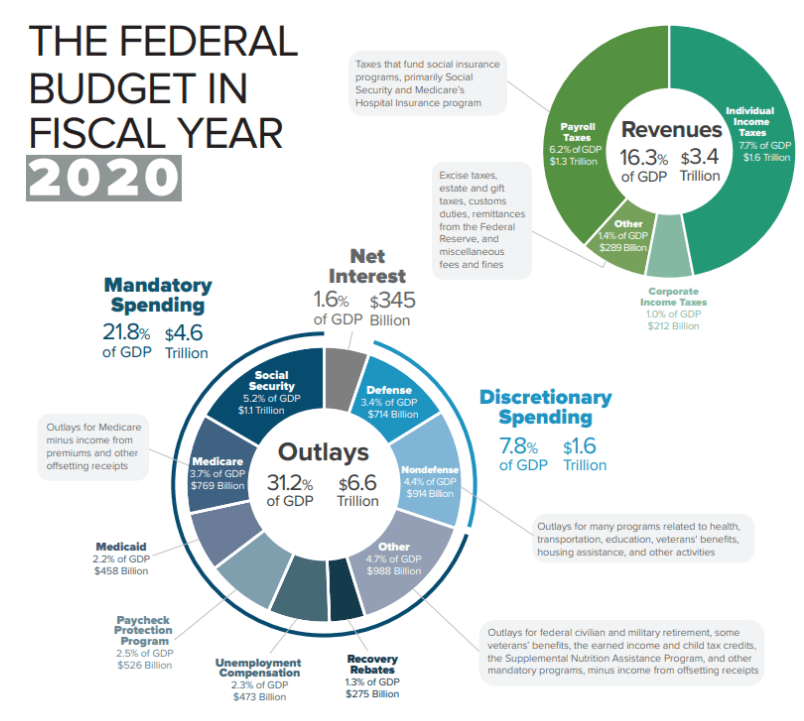
Congressional Budget Office
Visual 4-4: Financial Report of the U.S. Government 2020
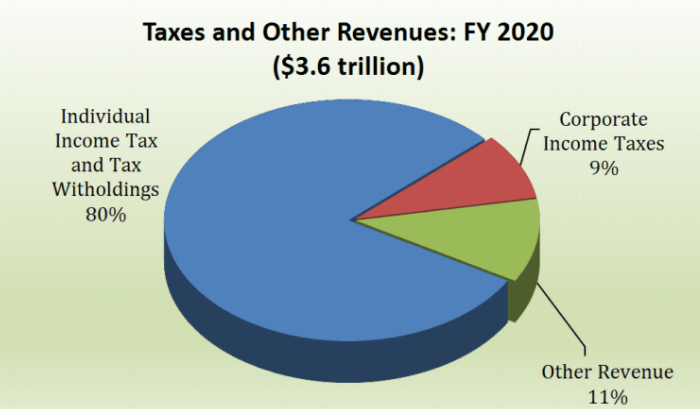
2020 Financial Report of the U.S. Government
Visual 4-5: Federal Budget vs. Financial Report in 2019
Spending
| Planned (Budget)Dollars | Actual (Financial Report)Dollars | |
| Social Security | $1 Trillion | $1.12 Trillion |
| Medicare/Medicaid (Dept of Health and Human Services) | $1.05 Trillion | $1.22 Trillion |
| Defense | $676 Billion | $918 Billion |
| Interest on the Debt | $375 Billion | $408 Billion |
| Other | $1.30 Trillion | $1.43 Trillion |
| Total | $4.4 Trillion | $5.1 Trillion |
Revenue
| Planned (Budget)Dollars | Actual (Financial Report)Dollars | |
| Individual Income Taxes | $1,700 Billion | $2,880 Billion |
| Payroll Taxes (Tax Withholdings) | $1,200 Billion | |
| Corporate Income Taxes | $230 Billion | $324 Billion |
| Other Revenue | $271 Billion | $396 Billion |
| Total | $3,500 Billion | $3,600 Billion |
Deficit/Surplus
| Planned (Budget)Dollars | Actual (Financial Report)Dollars | |
| Revenue |
|
|
| Spending |
|
|
| Total |
|
|
Visual 4-6: Federal Budget vs. Financial Report in 2020
Spending
| Planned (Budget)Dollars | Actual (Financial Report)Dollars | |
| Social Security | $1.09 Trillion | $1.18 Trillion |
| Medicare/Medicaid (Dept of Health and Human Services) | $1.38 Trillion | $1.41 Trillion |
| Defense | $714 Billion | $740 Billion |
| Interest on the Debt | $345 Billion | $4.07 Trillion |
| Other | $3.03 Trillion | |
| Total | $6.6 Trillion | $7.4 Trillion |
Revenue
| Planned (Budget)Dollars | Actual (Financial Report)Dollars | |
| Individual Income Taxes | $1,609 Billion | $2,880 Billion |
| Payroll Taxes (Tax Withholdings) | $1,310 Billion | |
| Corporate Income Taxes | $212 Billion | $324 Billion |
| Other Revenue | $289 Billion | $396 Billion |
| Total | $3.42 Trillion | $3.6 Trillion |
Deficit/Surplus
| Planned (Budget)Dollars | Actual (Financial Report)Dollars | |
| Revenue |
|
|
| Spending |
|
|
| Total |
|
|
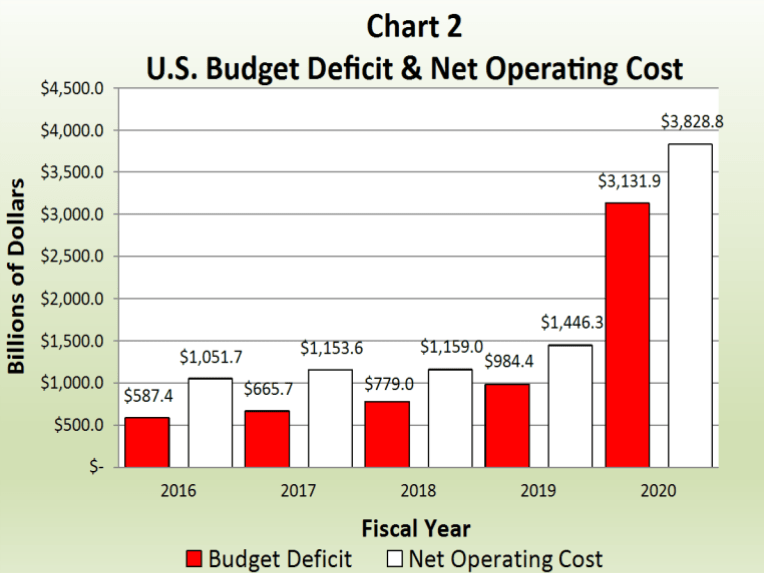
Visual 4-7: U.S. Government Planned Deficit vs. Actual Deficit
The chart below compares the government’s “planned” budget deficit (revenue – outlays) with the actual deficit or “net operating cost” (revenues – costs) for fiscal years 2016 – 2020. While these numbers may look positive, remember they represent the planned and actual shortfall each year, so the numbers in white are added to the National Debt.
2020 Financial Report of the U.S. Government

Read Across America Day 2026: Celebrating a Nation of Diverse Readers
March 2, 2026 When we asked our staff what they are reading right now, the responses felt exactly like FTE…

Empowering Educators: Michele Mar’s Journey with FTE
February 26, 2026 FTE’s commitment to excellence in economic education starts with its teachers – and each year, we have…

The True Cost of Glory: What Economics Teaches Us About the Winter Olympics
February 19, 2026 As Norway celebrates its 15th gold medal and Italy rallies behind its home team’s nine golds at…